
Analysis & Signals
We cannot explain everything about our signal analysis here, so we will explain very simple but strong signals. We use the following factors to produce LONG or SHORT signals. LONG when the price breaks up the falling wedge resistance line and RSI Pivot resistance get broken. SHORT when the price breaks down the rising wedge support line and RSI Pivot support get broken.
Entries
Here's the example for SHORT signal for BTC/USD pair.
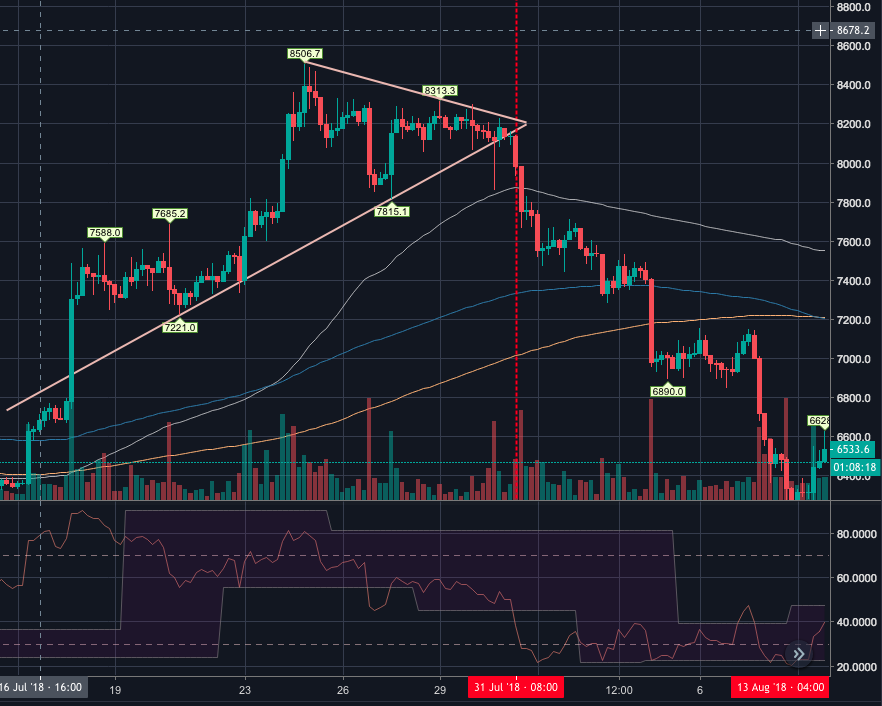
As you can see in above image, BTC price is in symetrical triangle (neutral), and we can’t know where it will go. At 31 July 2018, the price went down below $8000 and RSI already broke horizontal support. So the strategy will produce SHORT signal in above case.
Here’s another example of SHORT signal.
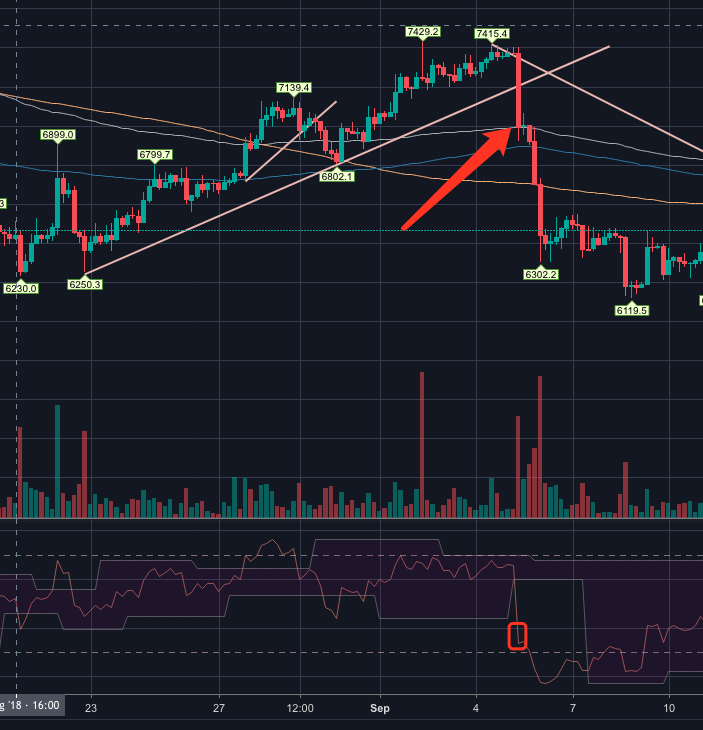
Above example is showing us price broke rising wedge SUPPORT line and RSI broken it’s dynamic SUPPORT, so SHORT signal will triggered.
Here’s another example of LONG signal.
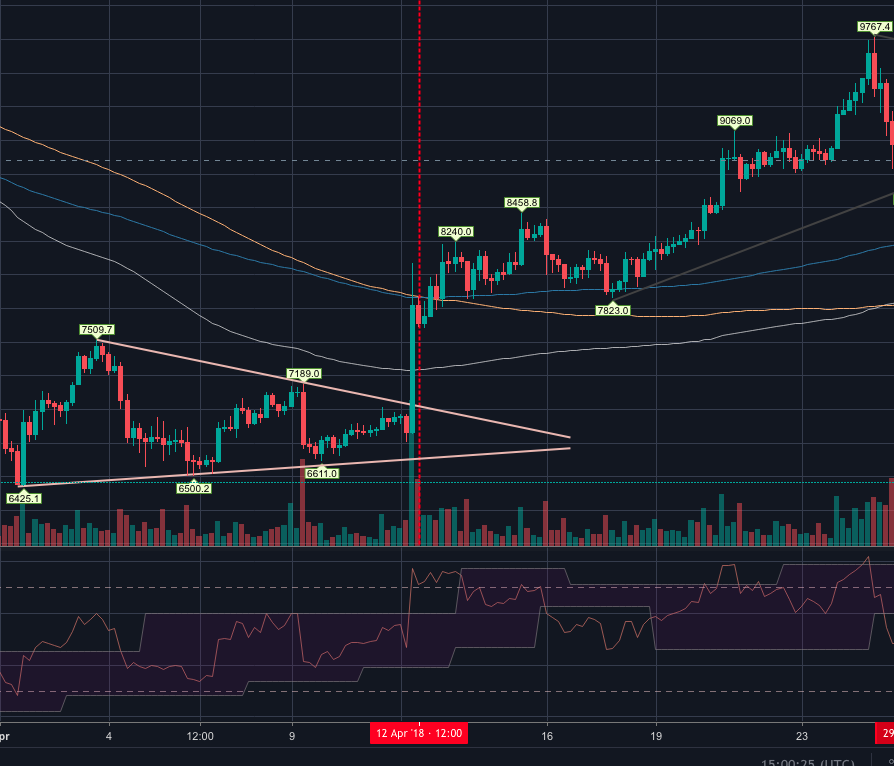
As you can see, once wedge RESISTANCE line broken, RSI break it’s RESISTANCE, MarginBot triggers LONG signal. If you want to check more details, please check the following link.
Stop-Loss
TP levels and SL prices are measured by volatility and found support lines. When every LONG or SHORT signal executed, MarginBot will set TP & SL orders automatically.
Targets
Exit
Setting up every single trade means make the solid rules for entry, exit, tp(take-profit), sl(stop-loss). So MarginBot also produces signals to close LONG or SHORT positions. Exit signal is the most tough task for MarginBot and we will explain the exit moment of wedge strategy signal. Here’s the example of the signal to close SHORT position.
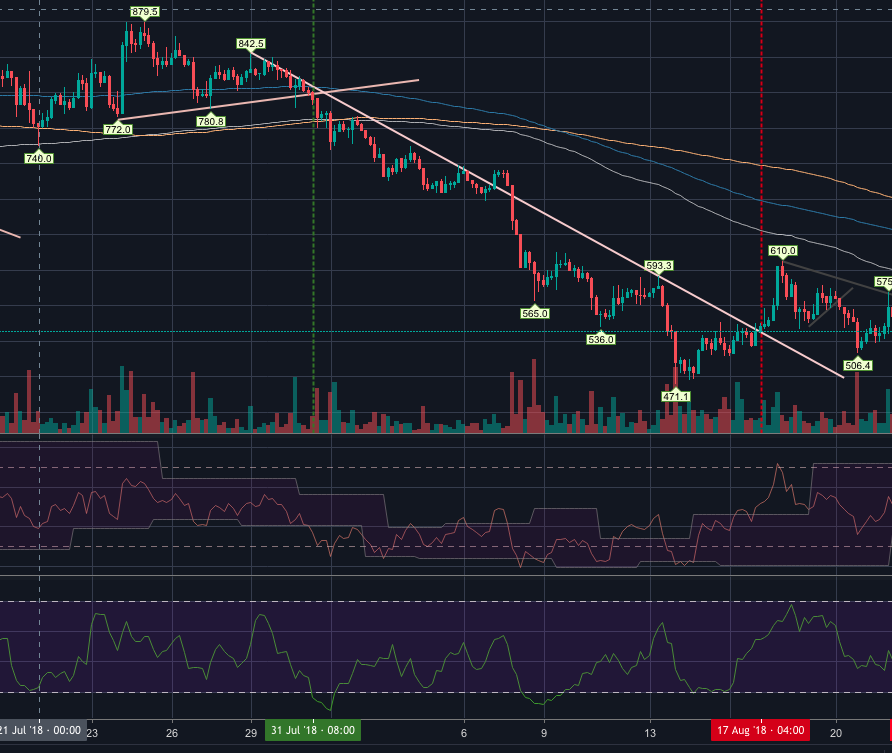
As you can see green vertical line is ENTRY moment and red vertical line is EXIT moment. MarginBot trading engine will close SHORT when falling wedge resistance line breaks.