
Introduction
Wedge breakout strategy is the volatality breakout strategy to catch the market directional movement when wedge patterns (ex: falling wedge, rising wedge or symmetrical triangle) are detected and support/resistance line is broken.
Wedge Patterns
Of all the reversal patterns we can use in the crypto market, the rising and falling wedge patterns are two of MarginBot favorite. They can offer massive profits along with precise entries for the trader who uses patience to their advantage.
One of the great things about this type of wedge pattern is that it typically carves out levels that are easy to identify. This makes our job as price action traders that much easier not to mention profitable.
Characteristics of a Wedge
The rising and falling wedge patterns are similar in nature to that of the pattern that we use with our horizontal support/resistance line breakout strategy. However because these wedges are directional and thus carry a bullish or bearish connotation, MarginBot figured them worthy of their own lesson.
The first thing to know about these wedges is that they often hint at a reversal in the market. Just like other wedge patterns they are formed by a period of consolidation where the bulls and bears jockey for position.
While both patterns can span any number of days, months or even years, the general rule is that the longer it takes to form, the more explosive the ensuing breakout is likely to be.
As the name implies, a rising wedge slopes upward and is most often viewed as a topping pattern where the market eventually breaks to the downside.
The illustration below shows the characteristics of the rising wedge.
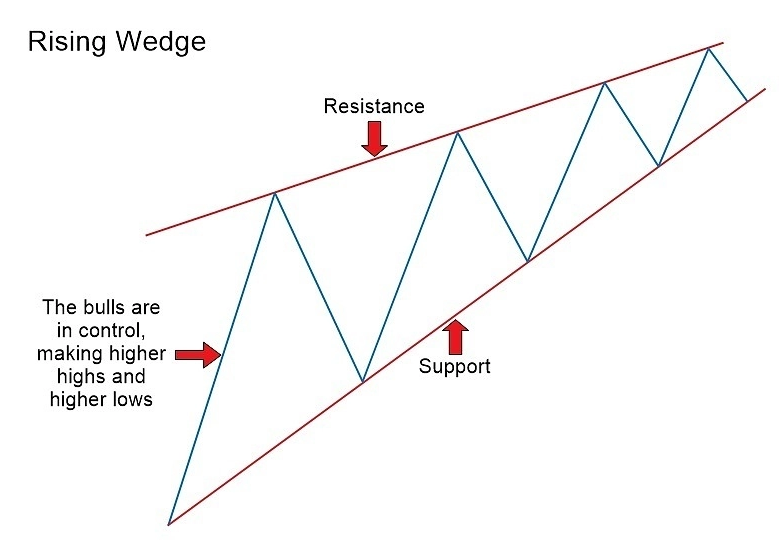
Notice how the rising wedge is formed when the market begins making higher highs and higher lows. All of the highs must be in-line so that they can be connected by a trend line. The same goes for the lows. It cannot be considered a valid rising wedge if the highs and lows are not in-line.
Because the two levels are not parallel it’s considered a terminal pattern. This implies that it must eventually come to an end.
The falling wedge is the inverse of the rising wedge where the bears are in control, making lower highs and lower lows. This also means that the pattern is likely to break to the upside.
The illustration below shows the characteristics of a falling wedge.
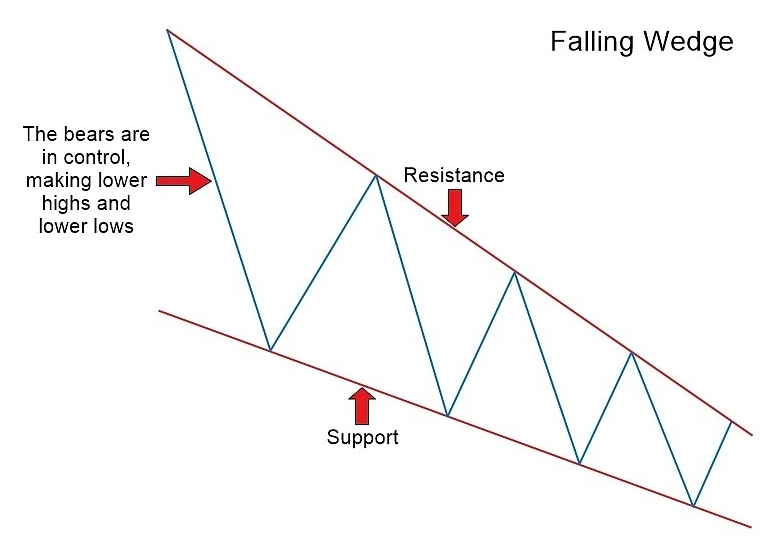
In the illustration above, we have a consolidation period where the bears are clearly in control. We know this to be true because the market is making lower highs and lower lows.
Notice how all of the highs are in-line with one another just as the lows are in-line. If a trend line cannot be placed cleanly across both the highs and the lows of the pattern then it cannot be considered valid.
Lastly, when identifying a valid pattern to trade, it’s imperative that both sides of the wedge have three touches. In other words, the market needs to have tested support three times and resistance three times prior to breaking out. Otherwise, it cannot be considered tradable.
Trading the Breakout
Depending on multiple timeframes (1-hour / 4-hours / 8-hours / 1-day candle), the trade opportunity comes when the market breaks below or above wedge support or resistance respectively.
A common question when it comes to trading breakouts is which time frame is best to use. Should we wait for a 4 hour close beyond the level or should we only consider an entry on a daily close?
The answer depends on the setup in question. It all comes down to the time frame that is respecting the levels the best.
More on that later. For now, let’s focus on how to trade the breakout. First up is the rising wedge.
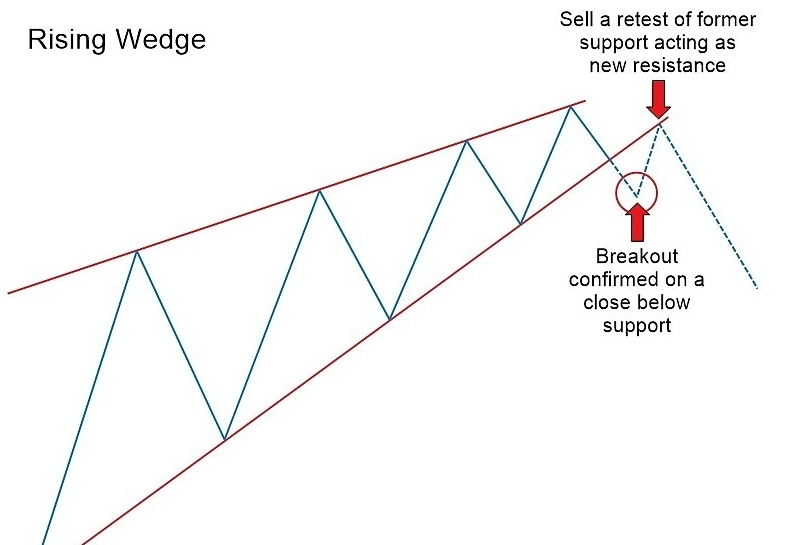
Notice in the image above we are waiting for the market to close below the support level. This close confirms the pattern but only a retest of former wedge support will trigger a short entry.
Why a retest?
Put simply, waiting for a retest of the broken level will give you a more favorable risk to reward ratio.
The same holds true for a falling wedge, only this time we wait for the market to close above resistance and then watch for a retest of the level as new support.
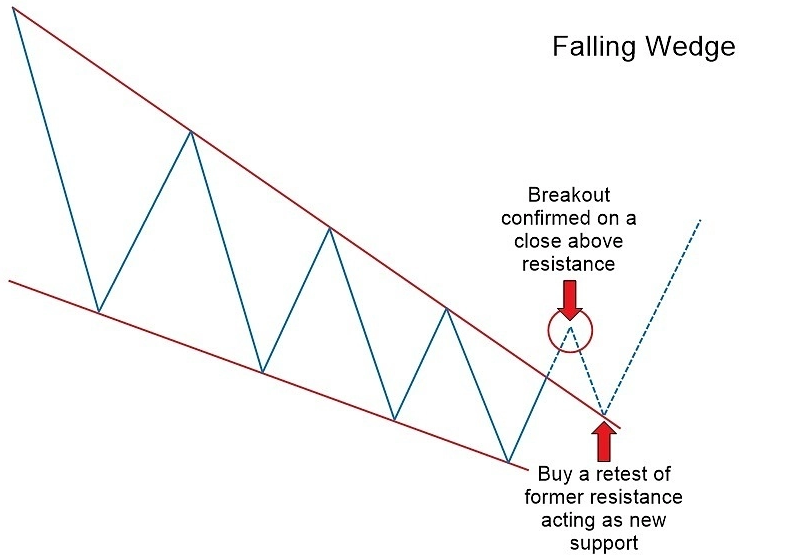
Notice how we are once again waiting for a close beyond the pattern before considering an entry. That entry in the case of the falling wedge is on a retest of the broken resistance level which subsequently begins acting as new support.
Although the illustrations above show more of a rounded retest, there are many times when the retest of the broken level will occur immediately following the break.